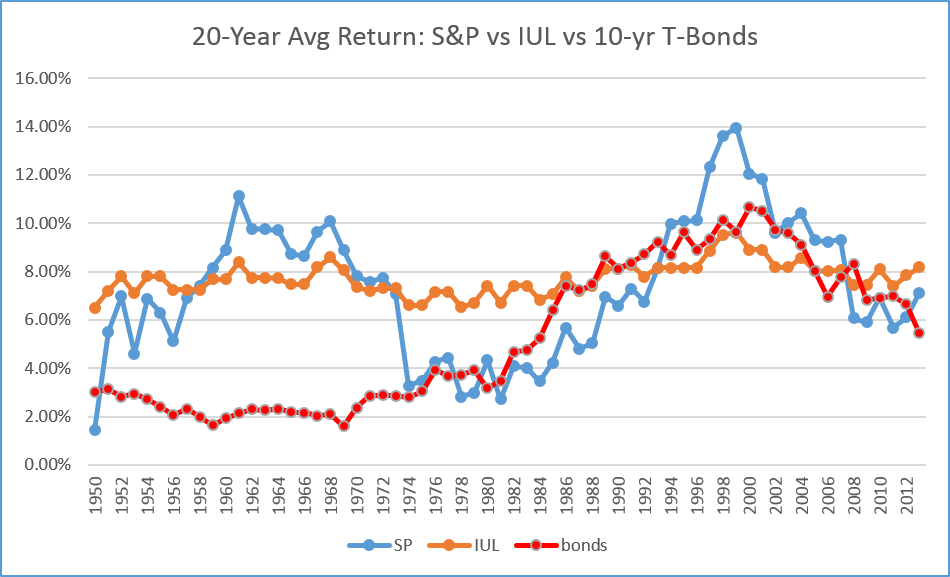
Most IUL's crediting features are similar - 0% floor and 11%-14% cap, the specific return will be based on the underlying index's performance.
For example, if the crediting is tied to S&P 500 index's annual performance, if S&P 500's actual return is -10%, IUL's return will be 0%, if S&P's actual return is 10%, IUL's actual return will be 10%, if S&P's actual return is 20%, IUL's actual return will be the cap level.
We have created an online tool so you can use it to back date test the IUL's average historical annual return. As the actual historical return chart below shows, IUL actually is a portfolio stabilizer - its average annual return is typically between bonds and stocks.


 RSS Feed
