
Q. I saw IUL products with large multipliers which means the cap could be much higher, what's the trick?
A. Be careful when you compare IUL products' illustrations, after ACTUARIAL GUIDELINE 49 (AG49), here is why.
AG49
First, what is AG49? In 2015, AG49 was developed to bring uniformity to the illustrations of policies tied to an external index or indices by providing a reasonable maximum on the illustrated credited rate. Uniformity across illustrations helps clients more easily compare policies of different companies. However, it’s also prompted the creation of very controversial product features: high fees and large multipliers.
Compare IUL Products
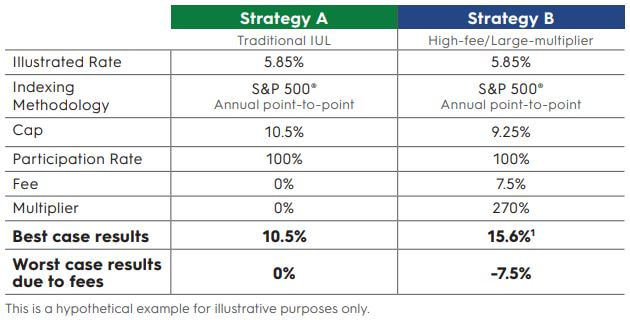
Now comparison of IUL products cannot simply be based on illustrated rates as a gauge for how a policy is going to perform, and what the risk/return profile of an IUL might be.
In the following example, both strategies show an illustrated rate of 5.85% - and much of the indexing specifications are similar. But, when you look closer, you see that Strategy B employs a multiplier and a fee. The best and worst case won’t show up because the illustration is only going to show averages – and won’t show the impact of paying the fee during years of zero index crediting. A consumer using Strategy B needs to be prepared for years that the cash value decreases because of the fees.
A. Be careful when you compare IUL products' illustrations, after ACTUARIAL GUIDELINE 49 (AG49), here is why.
AG49
First, what is AG49? In 2015, AG49 was developed to bring uniformity to the illustrations of policies tied to an external index or indices by providing a reasonable maximum on the illustrated credited rate. Uniformity across illustrations helps clients more easily compare policies of different companies. However, it’s also prompted the creation of very controversial product features: high fees and large multipliers.
Compare IUL Products
Now comparison of IUL products cannot simply be based on illustrated rates as a gauge for how a policy is going to perform, and what the risk/return profile of an IUL might be.
In the following example, both strategies show an illustrated rate of 5.85% - and much of the indexing specifications are similar. But, when you look closer, you see that Strategy B employs a multiplier and a fee. The best and worst case won’t show up because the illustration is only going to show averages – and won’t show the impact of paying the fee during years of zero index crediting. A consumer using Strategy B needs to be prepared for years that the cash value decreases because of the fees.
In the next blogpost, we will show you what these two products could actually perform in the real world and how they are different from what the illustrations show.
 RSS Feed
