
In last blogpost, we showed you two IUL products, one looks very good on paper with its large multiplier. Now we will show you their actual performances in the real world!
Actual Performances in Real World
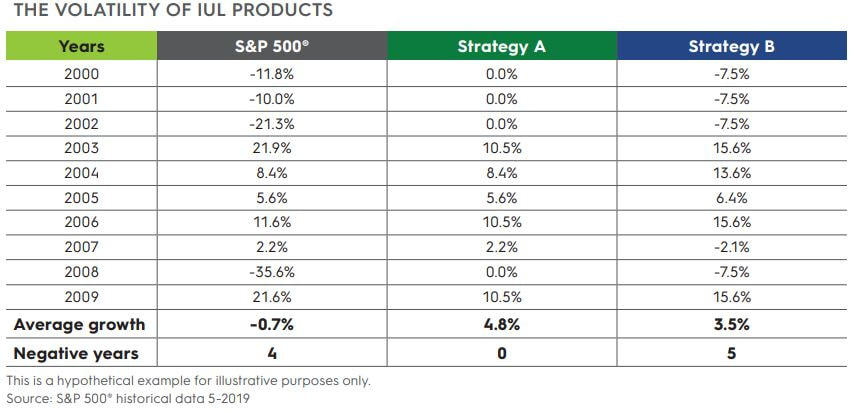
From 2000-2009, the S&P 500® was down an average -0.7%. During that same time, the traditional IUL example (Strategy A) experienced a 4.8% index credit, and although it had four years with 0% crediting – there were no negative impacts to a client’s cash value because of zero index crediting or indexing fees.
However, the story is a bit different with Strategy B. Its average index credit would have been 3.5% - but there were 5 years where the net result to the cash value was negative. The high-fee/large-multiplier strategy functioned as expected, accentuating the good years, but exposing the client to reduced cash values in other years because of the indexing fees.
Illustrations and illustrated rates don’t really help a client understand the impact of the volatility of indexing credits – including these negative years.
Actual Performances in Real World
From 2000-2009, the S&P 500® was down an average -0.7%. During that same time, the traditional IUL example (Strategy A) experienced a 4.8% index credit, and although it had four years with 0% crediting – there were no negative impacts to a client’s cash value because of zero index crediting or indexing fees.
However, the story is a bit different with Strategy B. Its average index credit would have been 3.5% - but there were 5 years where the net result to the cash value was negative. The high-fee/large-multiplier strategy functioned as expected, accentuating the good years, but exposing the client to reduced cash values in other years because of the indexing fees.
Illustrations and illustrated rates don’t really help a client understand the impact of the volatility of indexing credits – including these negative years.
The Bottom Line
It is more important than ever to understand the details of the products you are considering and talk to an expert who can be trusted. When you request an illustration run at a particular rate, you will need to be aware of any high fees and large multipliers that result in comparatively aggressive illustrations, even though the illustrated rate seems low.
 RSS Feed
