
Q. I was always reminded that funds' past performance is no guarantee of future performance. But if we can’t evaluate past performance, what are we supposed to look at to make reasonable and thoughtful investment decisions?
A. Averages derived over many years do matter because future performance tends to progress or regress toward the long-term average. It’s helpful to know the past to get a sense of the present.
For example, as shown in the chart “Performance of funds,” mutual fund and ETF average performance by category over more recent time frames has, in some cases, diverged considerably from the 30-year average performance. The general notion here is that the longer the time period is, the more reliable and useful the performance figure.
The same could be said for the chart "Performance of Indexes" below.
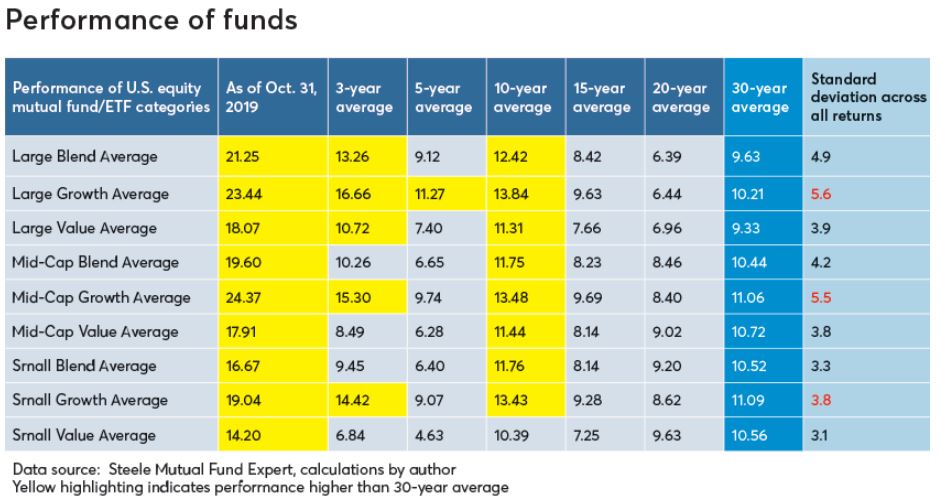
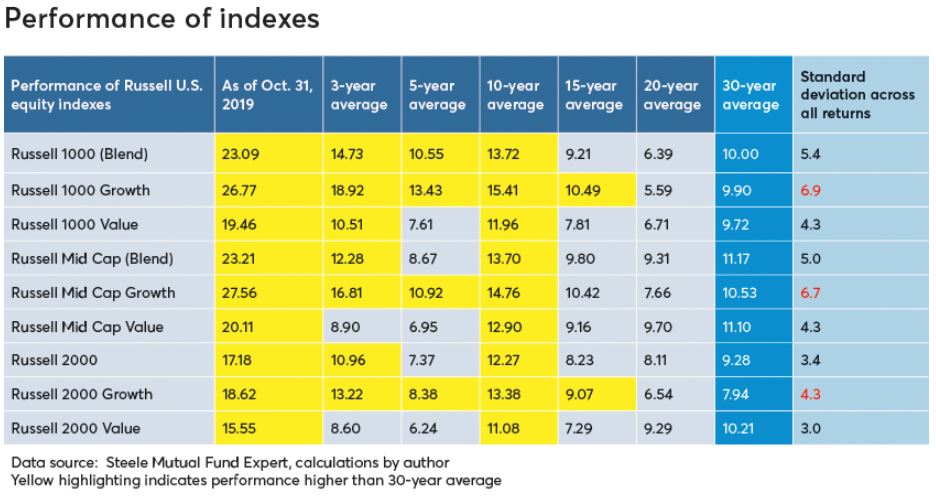
If you take a macro look at the tables, it’s clear the concentration of yellow highlighting is in the October, three-year, five-year and 10-year figures. Secondly, growth-oriented funds and indexes are more “in the yellow” than blend and value-oriented funds and indexes. Growth-based funds have enjoyed more recent success than blend- and value-oriented funds, hence are more likely to suffer more as they revert toward their longer-term average performance.
There is another metric in both tables that is somewhat unique and hopefully helpful. In the far-right column there is a standard deviation calculation. This figure represents the variation among the returns for all seven time periods. While this represents an unusual approach to the calculation of standard deviation, it is actually quite revealing.
What we see is a consistent pattern in which the standard deviation for growth-oriented funds and growth-oriented indexes is higher than blend (where blend is a mix of growth and value) and value-oriented funds and indexes. This clearly suggests that growth-oriented funds and indexes demonstrate wider swings in performance based on the time period being looked at. Mutual funds and ETFs that are classified as “blend” are the second-most volatile in terms of performance variation over different time periods, while value-oriented funds and indexes have the least amount of time-period performance variation.
 RSS Feed
